Per-release download tiles
Each tile links to the immutable v0.5 GitHub release tag on sigaihealth/atlas. Reviewer-access caveat: the atlas repository is currently restricted to organization members; unauthenticated requests return HTTP 404. Public-read access is a held GigaScience submission gate. The release URLs below resolve once the repo flips to public.
p_trust_ramp_n=30 floor; this is a documented release shape, not a bug.94cc08baa800…89d592be4104…a277af86a5b9…2ae90a7a48f3…panel_layer normal-tissue coverage
v0.5 introduces a first-class panel_layer manifest block that records each
release's normal-tissue panel coverage against the underlying probe catalog. The three
TCGA HM450 / hg19 releases share a 10-tissue, 687-sample broad-normal envelope.
Cross-cancer shared Tier B loci (3-way HM450 intersection)
Across the three HM450 / hg19 patient-cohort releases (COAD, LUAD, LIHC), the Tier B candidate sets share a 3-way intersection of 6,441 candidates / 1,378 probe loci / 1,635 nearest-gene symbols. Same loci, different signal strength across cancers. BRCA EPIC-v2 / hg38 is omitted from this intersection by design: cross-platform candidate-id overlap is incoherent (different probe space + different reference assembly).
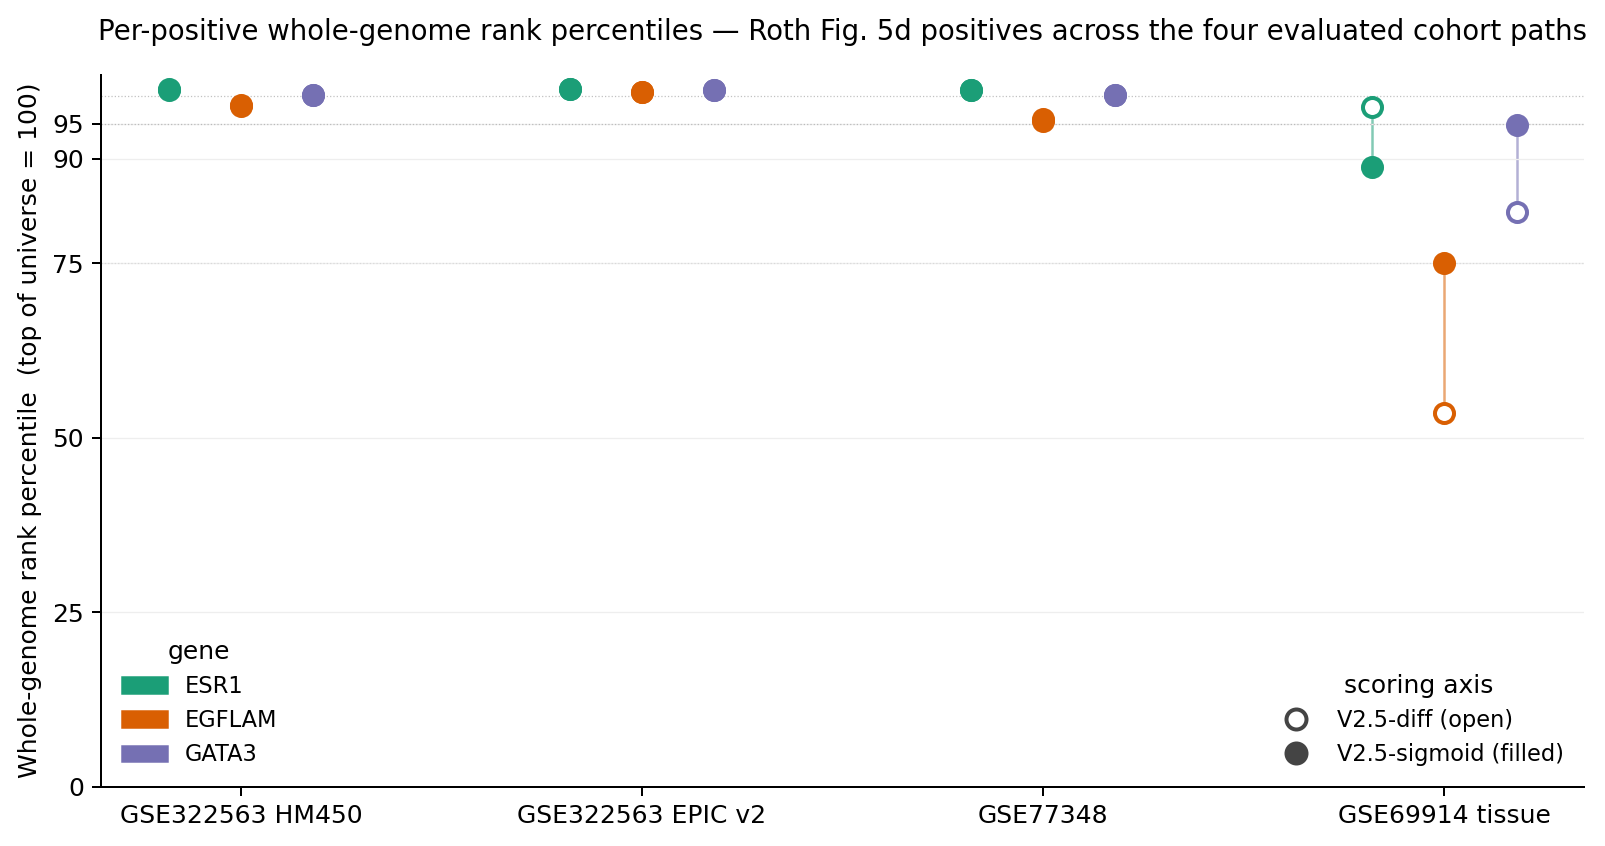
Headline figure — per-positive whole-genome rank percentiles
What to read off the plot.
-
On the three matched cell-line cohorts (left three columns), V2.5-diff and V2.5-sigmoid sit on top of
each other above the 95-percentile line — AUC parity within 0.002. The
tie_band@100collapse from 421–1,493 records under V2.5-diff to 1 under V2.5-sigmoid is the actual usability story on these cohorts; this dot-plot only shows that the ranks are equivalent in position. -
On the GSE69914 tissue cohort (right column), the dumbbells stretch — and not all in the same
direction. GATA3 and EGFLAM improve substantially under V2.5-sigmoid; ESR1
moves the wrong way. This is the non-uniform-superiority caveat the methods paper
discloses in §6.1: in the GSE69914
EXACT + PROXIMAL_CLOSErestricted-universe subset (where ESR1 is the only evaluable positive), V2.5-sigmoid trails V2.5-diff, raw Δβ-only, and the limma-style baseline.
Per-cohort top-100 explorer
Pick a cohort, filter by gene symbol or PAM family. Rows highlighted in the accent color overlap a Roth Fig. 5d positive at the wide (±500 bp) tier. The full per-row schema (30+ columns including RepeatMasker overlap and CGI distance) lives in the per-cohort TSV linked below; this table shows the slim-schema columns that fit on a screen.
Summary by cohort
How rows on this page map to rows in the paper
- The dot-plot (fig4) visualizes the per-positive WG-rank table reported numerically in
PAPER §5.2.2. The data file (
examples/genome_wide_panel.md) is committed at the paper tag. - The per-cohort top-100 tables are the same artifact PAPER §5.5 reports at top-20,
expanded to top-100 for this website. They ship as
examples/<cohort>_roth_labels/top100_atlas.{tsv,md}atmemo-2026-04-22-bw. - The tie-band collapse story (V2.5-diff 421–1,493 → V2.5-sigmoid 1) is visible as the y-axis collapse in PAPER fig2; this atlas page does not duplicate that figure.
- The ESR1 reversal is highlighted graphically in the dot-plot above and discussed quantitatively in PAPER §5.7.
What is not in this atlas (intentionally)
- No TCGA pan-cancer rows. The framework includes a streaming k-way-merge pan-cancer aggregator and unpublished TCGA cohort scoring exists in the working tree, but those rows are not on this surface yet because they have not been audited against a tagged paper artifact and because publishing pan-cancer top-K shortlists on a corporate domain reads as a drug-discovery pipeline more than a benchmarked methods demonstration. A future v2 atlas may add a TCGA section behind explicit framing.
- No genome-browser / Manhattan view. The UCSC Genome Browser already does this
well; click any
candidate_idchromosome coordinate from the per-cohort TSVs to jump there. - No score-distribution histograms. Those live under
examples/*_roth_labels/as supplementary materials; this page intentionally scopes to "where do the candidates land" rather than "what does the score distribution look like."
Cite or reproduce
- Methods paper — PAPER.pdf
at tag
paper-5-10j; Bioinformatics-shaped short version MANUSCRIPT.pdf at tagmemo-2026-04-22-bw. - Atlas reproducer scripts — build_atlas_dotplot.py and build_atlas_top100.py.
- Roth et al., Nature 2026 — read the article on nature.com (DOI 10.1038/s41586-026-10384-z).